June 24: Lets get jiggy with it!

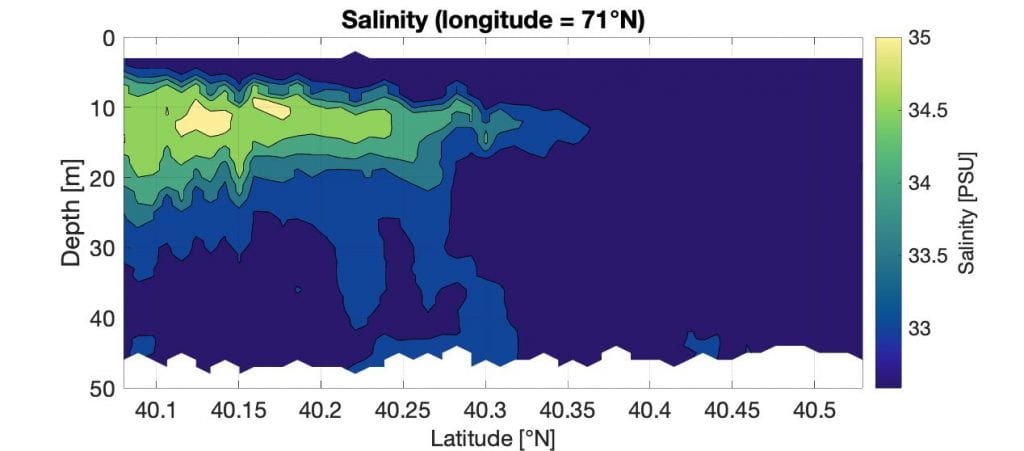
The squid jigging has began! A large component of this project is trying to understand the influence salinity intrusions have on  short fin squid. It is thought that the squids begin their journey in the Gulf Stream and then ride Warm Core Rings and these salinity intrusions shore ward and onto the shelf.

Squids are unable to store fat, and therefore need to be continually consuming food. In addition squids can even turn cannibalistic if there isn’t enough food availability! This gives the squid carried in Warm Core Rings and in intrusion large advantages.

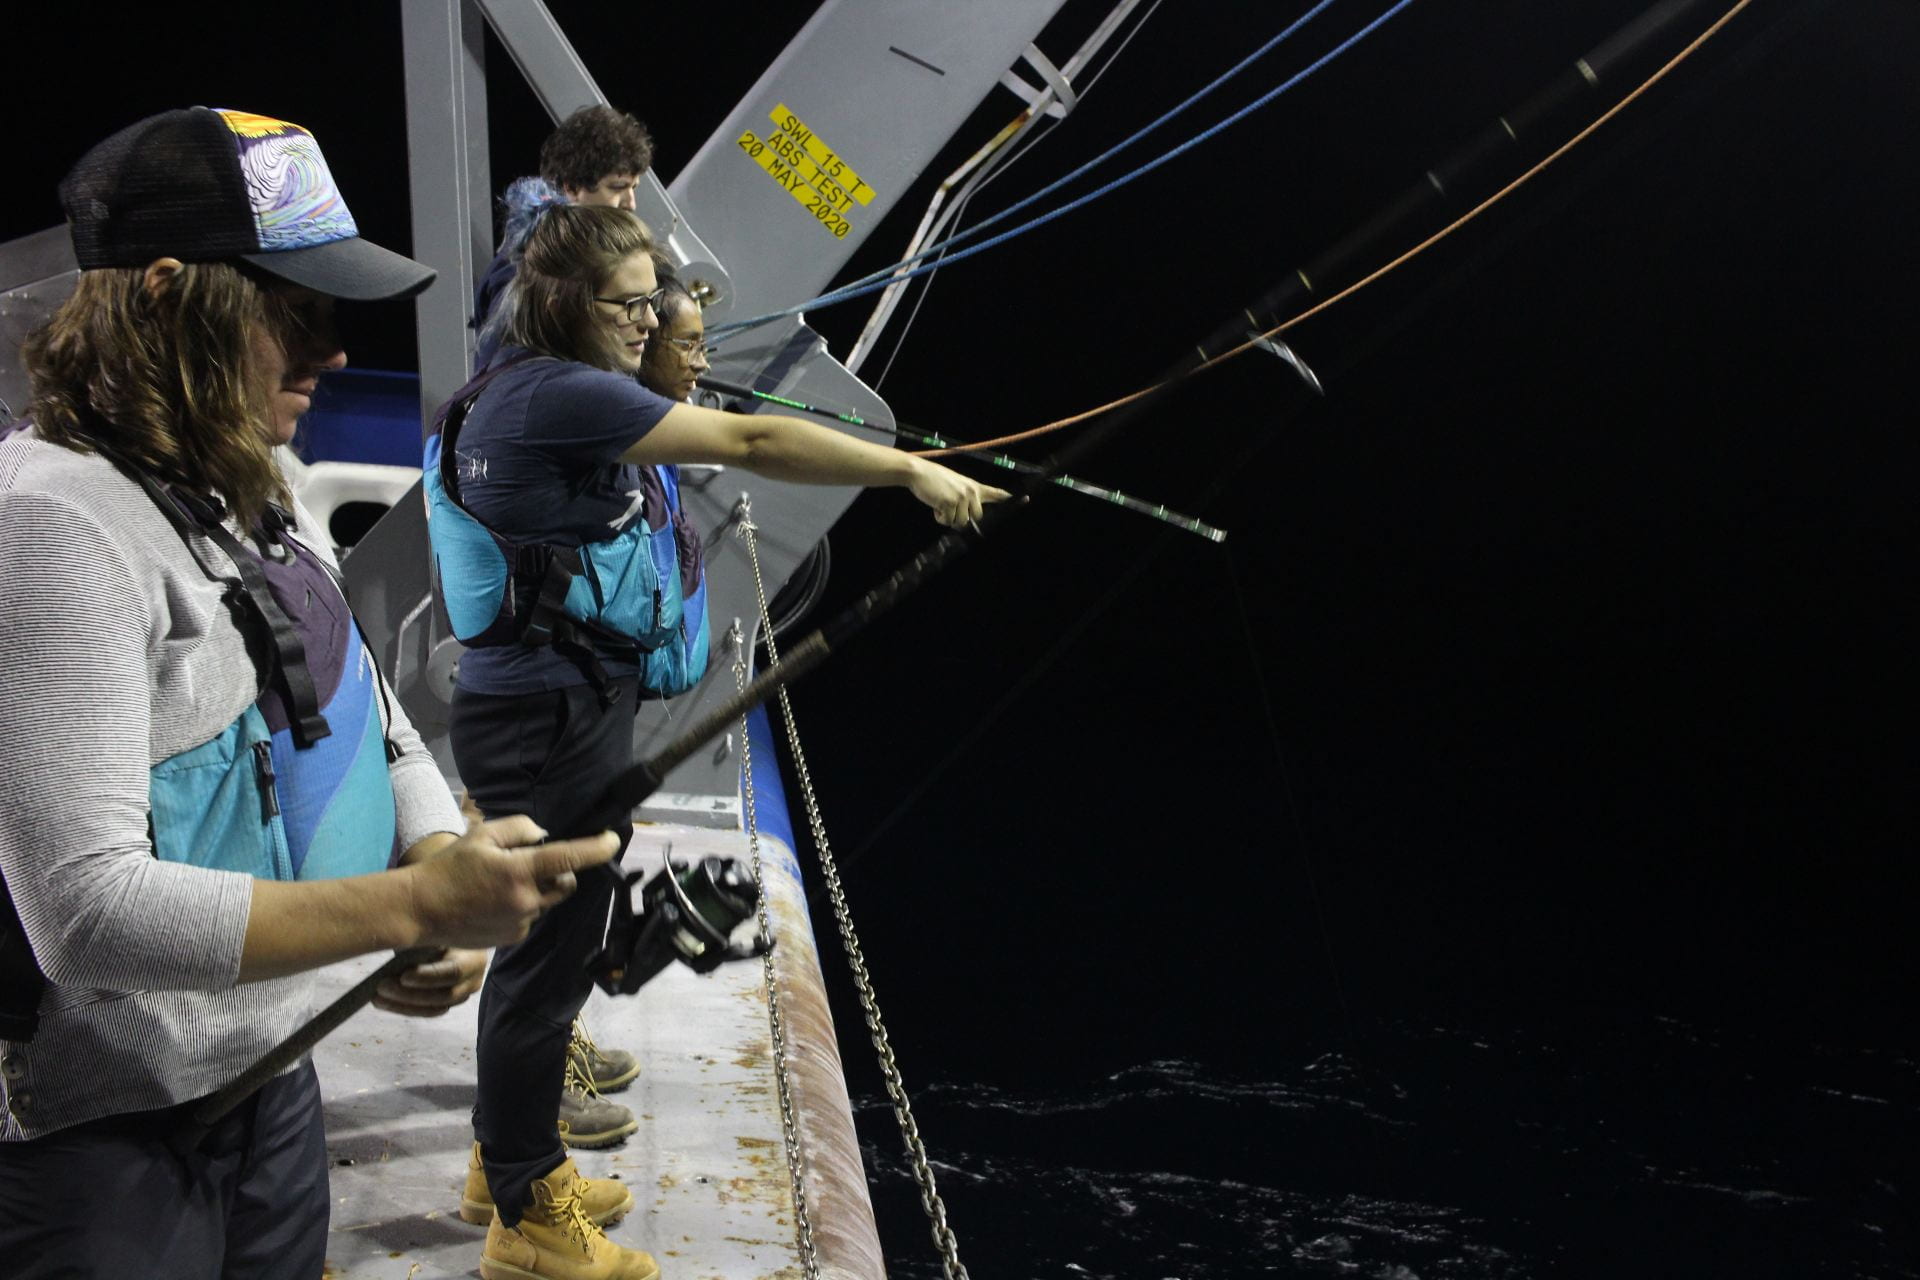
To see if there were squids at our intrusion spots we went out last night with fishing poles and cameras on sticks to capture the squid activity. At two of our intrusion spots squids were spotted! Unfortunately our jigging attempts were less successful, we will try again another night.

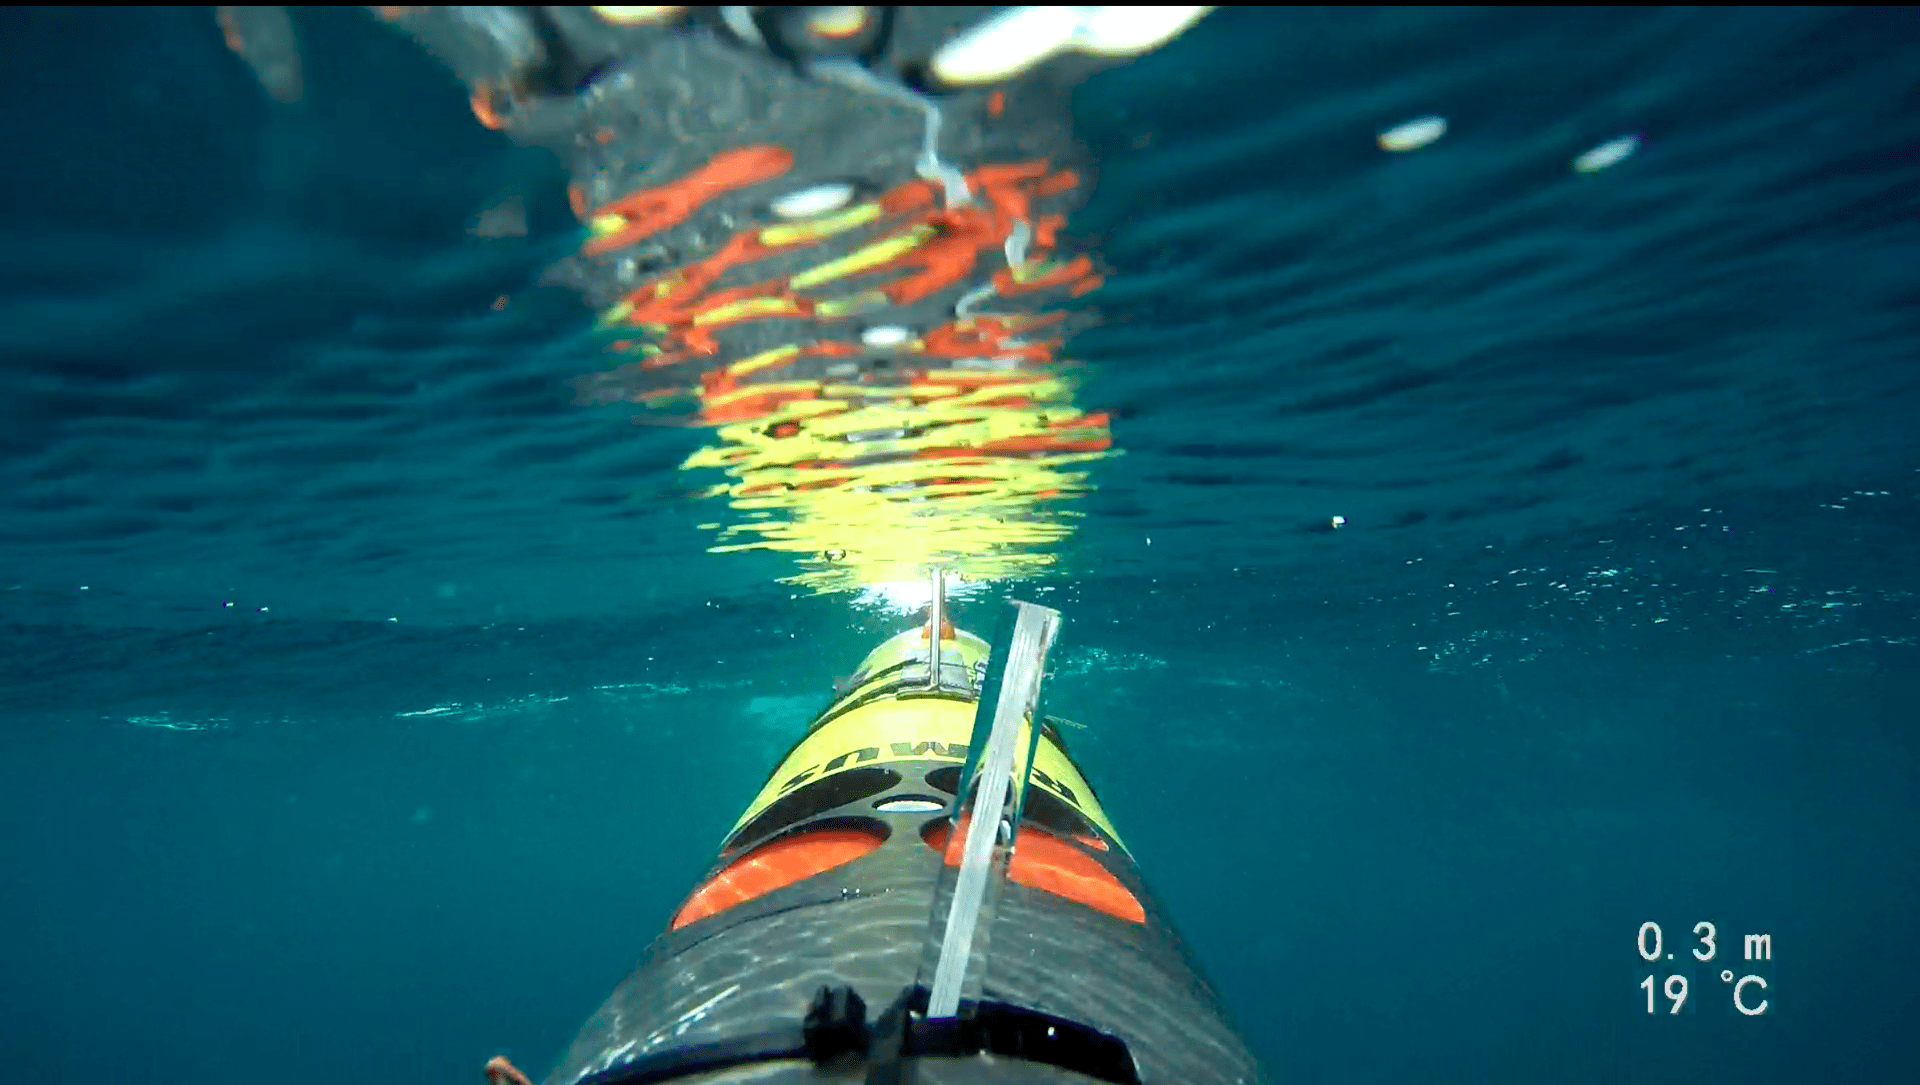
Try and spot the squid in the video linked bellow!

Squid Video

Night squid jigging off the back of the boat.

June 23: Meet’n’greet with Edgar, Darter, and Sellers

Today we sample a 40x40km area east of our home base along the 71°W longitude line. With CTD casts we want to get a first overview about the extent of a 2nd intrusion area. While steaming to our next station, let’s take the time to feature our underwater robots of the REMUS family. We have 3 Remus-100’s with us on board the Armstrong, Darter, Edgar, and Sellers. These vehicles have a depth rating of 100 meters.

Edgar coming back to surface after a mission

How do the REMUS missions work?

The vehicles communicate differently when at the surface and while underwater. At the surface, they’re use Wifi, make satellite phone calls, and get GPS coordinates from satellite. However, none of these systems work underwater and signals between the ship and the REMUS get transferred acoustically.

The vehicles are equipped with a variety of instruments to measure temperature, salinity, nitrate, dissolved organic matter, water velocity, and many variables more. In addition, we can make videos with a GoPro. Depending on the mission, the instrumentation can be adapted.

How does the AUV-Team’s day look like:

The SciBotics team working on updating Darter.

After a daily discussion with the science team, our AUV-Team (Amy, Noa, and Maaya) choose the best suited Remus for the day’s mission data goals and prepare the vehicle for deployment. A so-called Towfish, the 25kHz transducer used to acoustically communicate with the vehicles, is secured to the boat railing and lowered into the water prior to deployment. Once the vehicle is in the water and communications between us and the vehicle are established, we send the vehicle on its mission and stay within acoustic range until it’s time for recovery.

For more information on the AUV’s and the SciBotics team head to their website linked here.

June 22: Up and down

Today had its ups and downs… 98 ups and downs to be precise: The VMP samples the water column like a yo-yo: Up and down… When releasing it, it falls down with a constant velocity and measures salinity, turbulent mixing, and many other variables. Then, we recover it with a motorized deep-sea fishing reel. One cast takes about 3min which allows great spatial resolution. Check out our salinity transact below.

Salinity transact of the VMP. We travelled northward, left the
intrusion (yellow colored sections) , and captured the intrusion’s nose on
the way out. In the north you see colder and fresher shelf water. The
intrusion moves northward by “sneaking” into a density gap between two
different water layers.

June 21: AUV Polaris starts its journey

Thanks to our AUVs we can sample at two locations at the same time. Yesterday  we released AUV Polaris that will sample a pre-defined box throughout the next couple of days. Every time it surfaces, its position and data will be transferred via satellite. You can follow Polaris’s progress on the site linked here.

Engineer Noa with AUV Polaris before launch.
View from an AUV during recovery.

Hurricane Claudette seems to pass us further south than originally expected. Thus, we did not need to seek shelter close to Martha’s Vineyard and were able to stay close to the intrusions. …

And we had our first squid-sighting! While taking evening CTDs close to the nose of the intrusion the squid were drawn in by the ship’s lights.

June 20: The VMP knows where the intrusion’s nose goes.

Everything must come to an end… even an intrusion that comes onto the shelf and travels northward into fresher shelf waters. In order to estimate how the intrusions spreads, it is very important to sample the whole nose with high resolution.

This morning AUV Edgar found a nose. That means it’s time for our high-resolution instrument: The Vertical Microstructure Profiler (VMP). The delicate probes at the end of the 5ft-long instrument are smaller than a millimeter and measure over 500-times per second. This allows to estimate turbulence and mixing which could bring up nutrients further to the surface. When passing the nose, we saw a ton of jellyfish. Squids haven’t made it onto our AUV cameras, yet.

tl;dr: The VMP – today’s MVP!

The VMP gets deployed for its first mission.

June 19: Starting the AUV game

After an exciting start into the cruise today’s focus is on our Autonomous Underwater Vehicles (AUVs). These underwater-robots transact the water column in a zick-zack pattern, and provide us with a large variety of data, including videos from an upward-looking camera (stay tuned). Since our CTD-casts from yesterday revealed strong spatial variability on scales larger than 5nm, we hope that the AUVs fills in the gaps on smaller scales.

AUV Darter gets launched over the starboard side of the ship. The operators need to be careful that it doesn’t hit the ship wall. After being released, Darter follows a pre-defined mission pathway. It communicates with the team on the ship when surfacing.

June 18: HEUREKA!!! We found an intrusion!

Wow! Nobody of us had imagined that we will find a salinity intrusion that fast. But already in the afternoon (and with around 80m of water below out feet) the excitement on the science deck was unbounded: We found not just ONE intrusion, but TWO.

… heading further south now to check from where it might have come onshore.

Discussion on the Science deck. We know the resolution is tough, but do you see the salinity intrusions (blue curve) around 10 and 30m?

June 18, 2021 (First day of SIRATES at Sea)

After a year of delays the SIRATES finally set sail! We’re all excited and am looking forward to sharing our impressions from out of sea.

The trip started with with a three hour journey from Woods Hole to our first CTD station. A CTD is an oceanographic sensor system that measures the conductivity, temperature and depth throughout the water column.  This allows oceanographers to study the composition of the different interacting layers. The plan is to do nine profiles from  41°N, 71°W going southward.

But first, who are we on board? Here is a picture of us:

This is us — the SIRATES Science Party: (from left to right) Glen, Maaya, Noa, Adrienne, Lukas, Frank, Erica. Not in the picture: Amy and Avijit.

June 17, Salinity Intrusion – An example

Since it is the Salinity Intrusion Experiment, it is a good time to show what the intrusion looks like.

Here is an example of a salinity intrusion from our Chief Scientist Glen Gawarkiewicz, WHOI. This is what an intrusion looks like in a vertical profile.

Vertical profile of Salinity. The intrusion delta_S is expressed by the excess of maximum salinity from its threshold values above and below which determines its thickness.