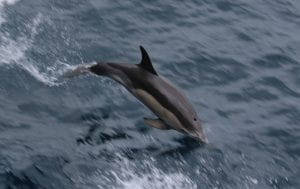
Alone on the ocean? No! We regularly get visited by lots of lovely animal friends. Check out our naturalist corner for some pictures (accessible at the top of the page just beneath the banner/title).
Salinity Intrusions, Rings, AUVs, Turbulence and Squid (SIRATES)
Looking for the Salinity Maximum Intrusion
Alone on the ocean? No! We regularly get visited by lots of lovely animal friends. Check out our naturalist corner for some pictures (accessible at the top of the page just beneath the banner/title).
Thanks to our AUVs we can sample at two locations at the same time. Yesterday we released AUV Polaris that will sample a pre-defined box throughout the next couple of days. Every time it surfaces, its position and data will be transferred via satellite. You can follow Polaris’s progress on the site linked here.

Hurricane Claudette seems to pass us further south than originally expected. Thus, we did not need to seek shelter close to Martha’s Vineyard and were able to stay close to the intrusions. …
And we had our first squid-sighting! While taking evening CTDs close to the nose of the intrusion the squid were drawn in by the ship’s lights.
Everything must come to an end… even an intrusion that comes onto the shelf and travels northward into fresher shelf waters. In order to estimate how the intrusions spreads, it is very important to sample the whole nose with high resolution.
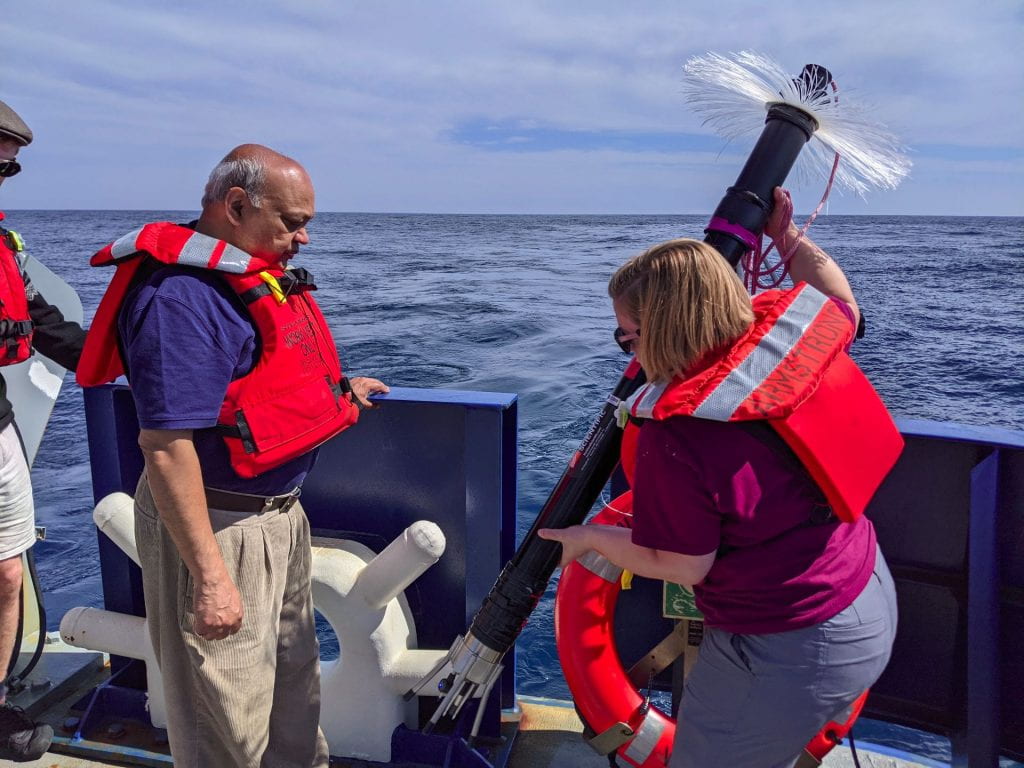
This morning AUV Edgar found a nose. That means it’s time for our high-resolution instrument: The Vertical Microstructure Profiler (VMP). The delicate probes at the end of the 5ft-long instrument are smaller than a millimeter and measure over 500-times per second. This allows to estimate turbulence and mixing which could bring up nutrients further to the surface. When passing the nose, we saw a ton of jellyfish. Squids haven’t made it onto our AUV cameras, yet.
tl;dr: The VMP – today’s MVP!
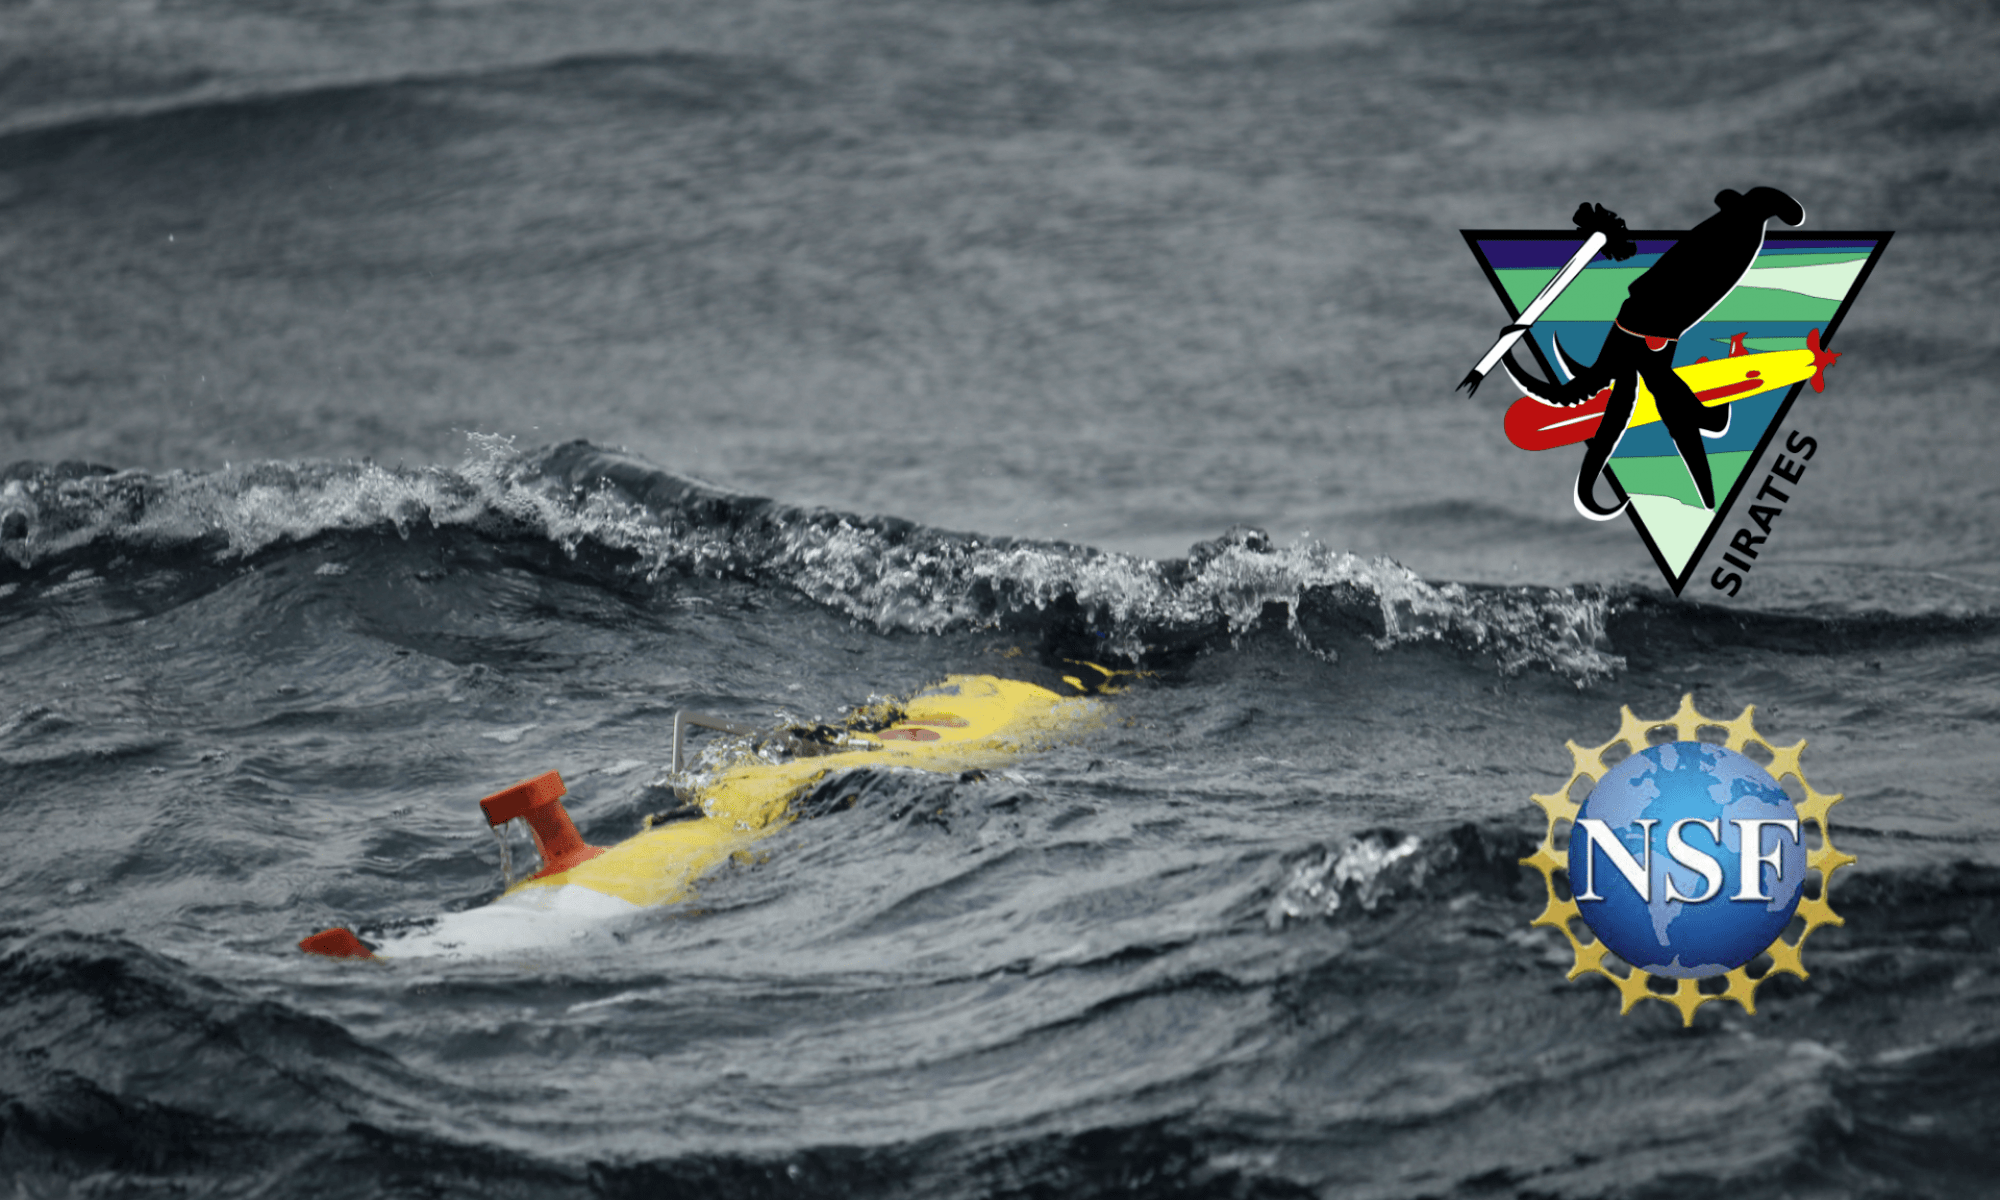
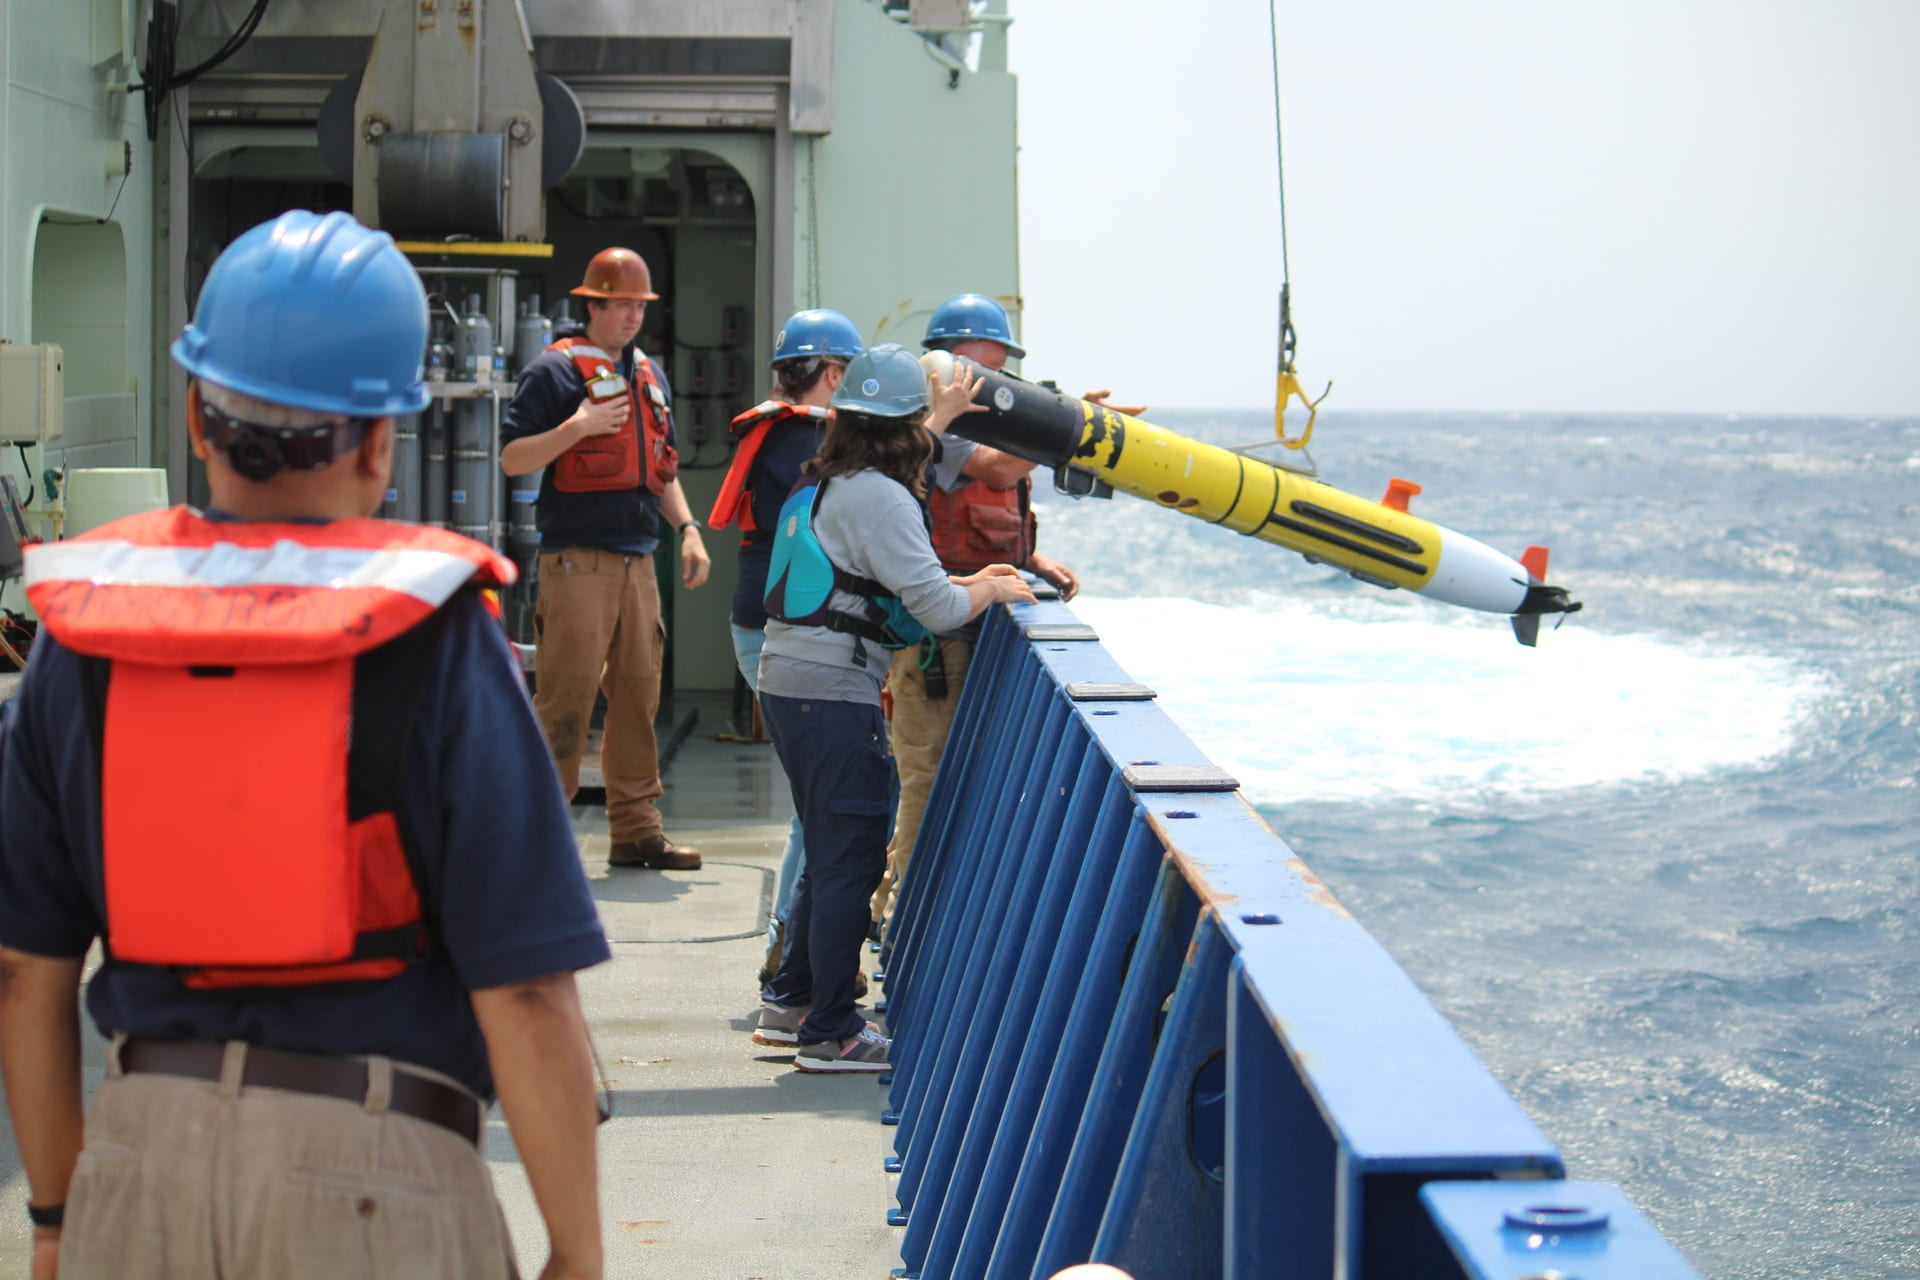
After an exciting start into the cruise today’s focus is on our Autonomous Underwater Vehicles (AUVs). These underwater-robots transact the water column in a zick-zack pattern, and provide us with a large variety of data, including videos from an upward-looking camera (stay tuned). Since our CTD-casts from yesterday revealed strong spatial variability on scales larger than 5nm, we hope that the AUVs fills in the gaps on smaller scales.
Wow! Nobody of us had imagined that we will find a salinity intrusion that fast. But already in the afternoon (and with around 80m of water below out feet) the excitement on the science deck was unbounded: We found not just ONE intrusion, but TWO.
… heading further south now to check from where it might have come onshore.
After a year of delays the SIRATES finally set sail! We’re all excited and am looking forward to sharing our impressions from out of sea.
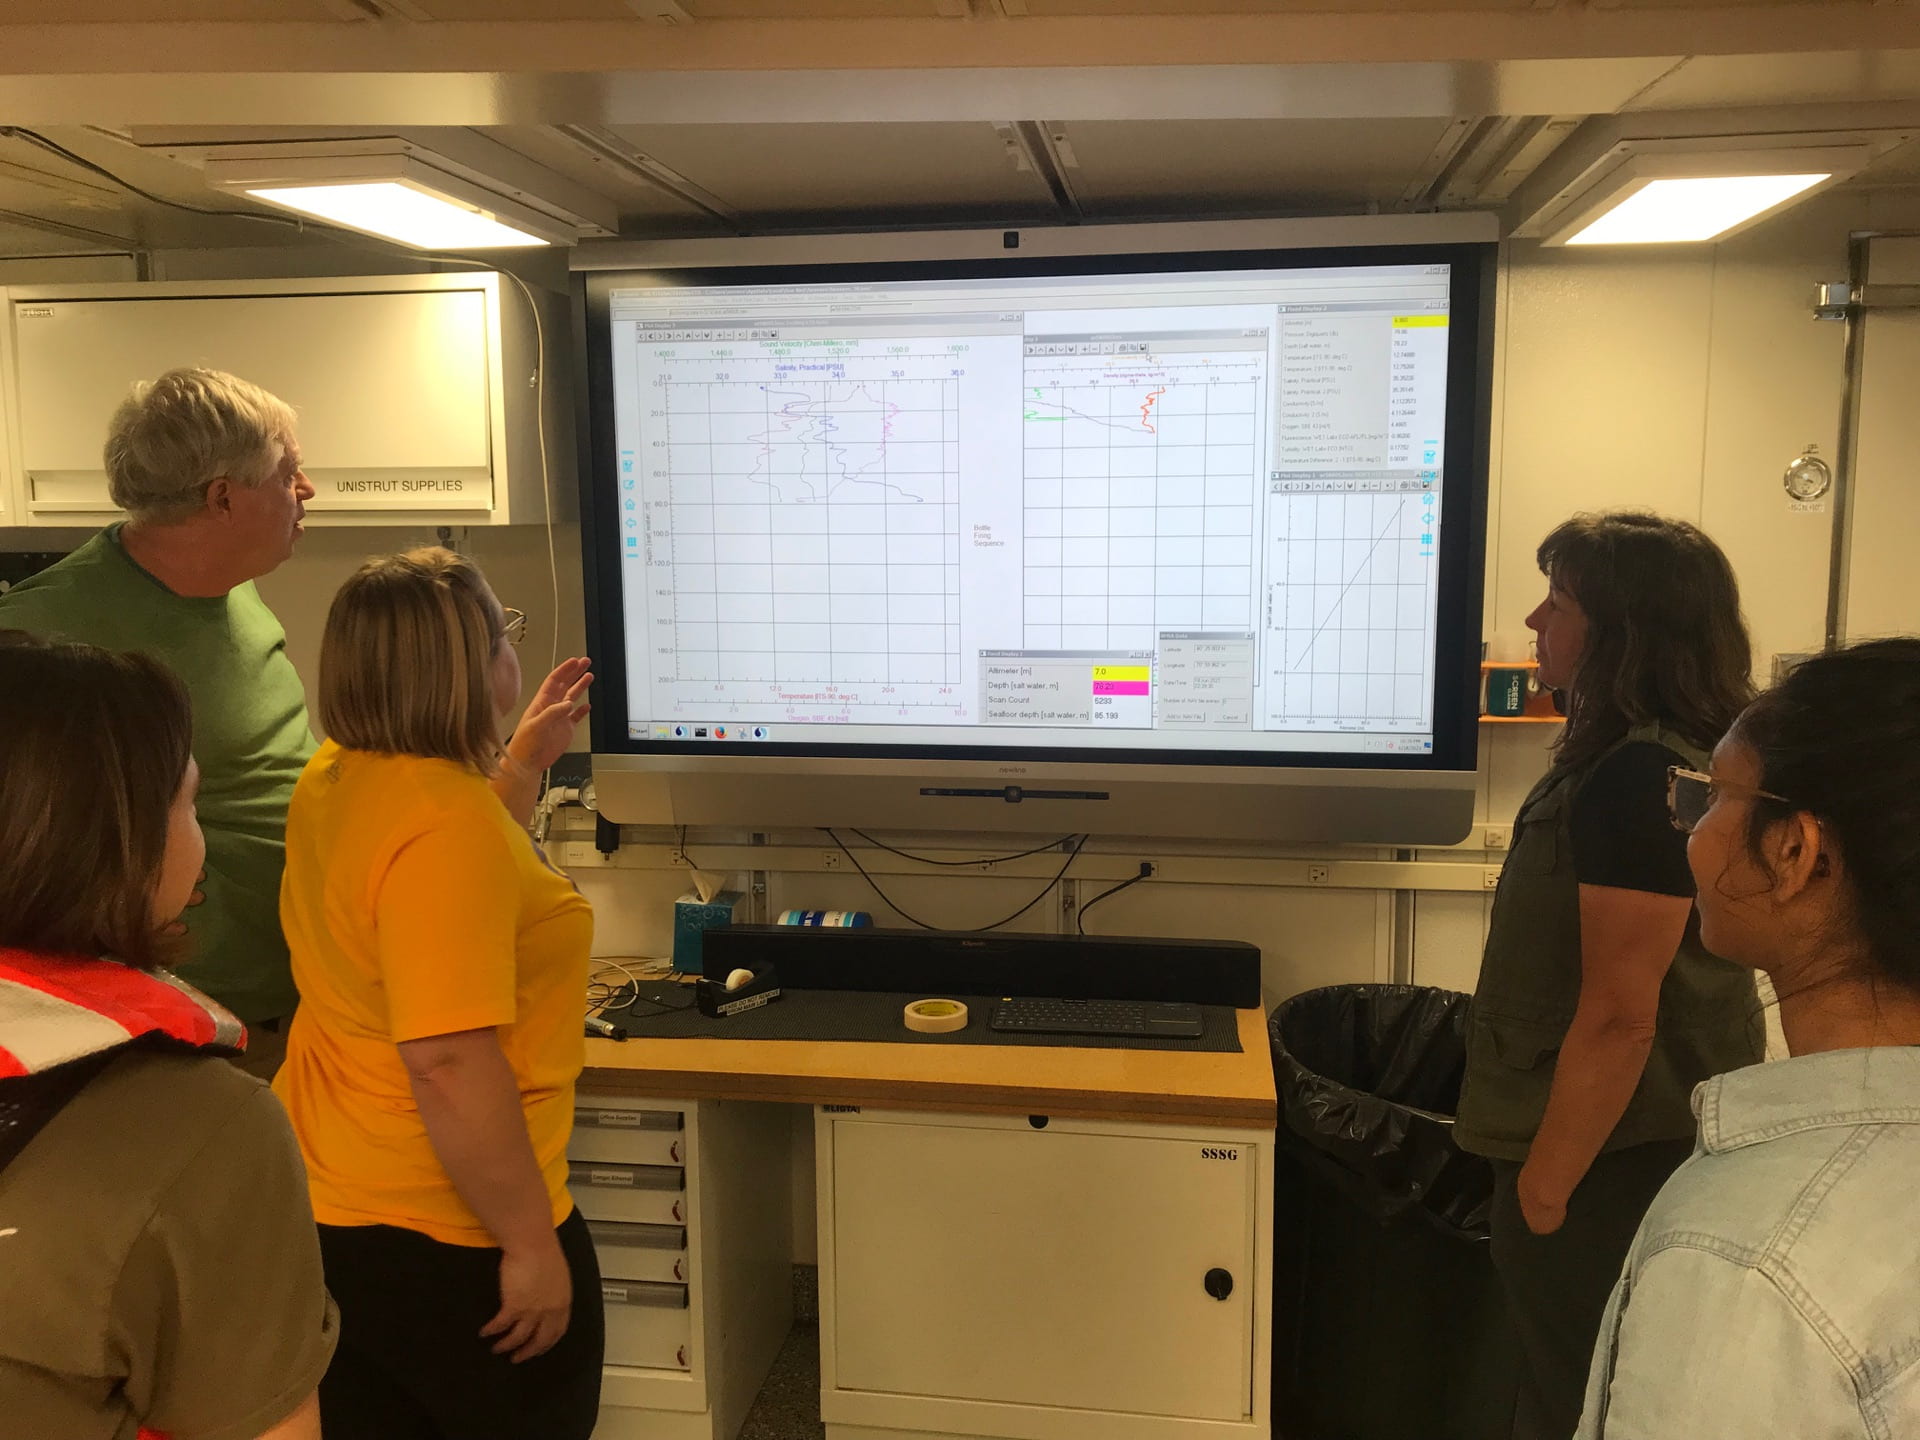
The trip started with with a three hour journey from Woods Hole to our first CTD station. A CTD is an oceanographic sensor system that measures the conductivity, temperature and depth throughout the water column. This allows oceanographers to study the composition of the different interacting layers. The plan is to do nine profiles from 41°N, 71°W going southward.
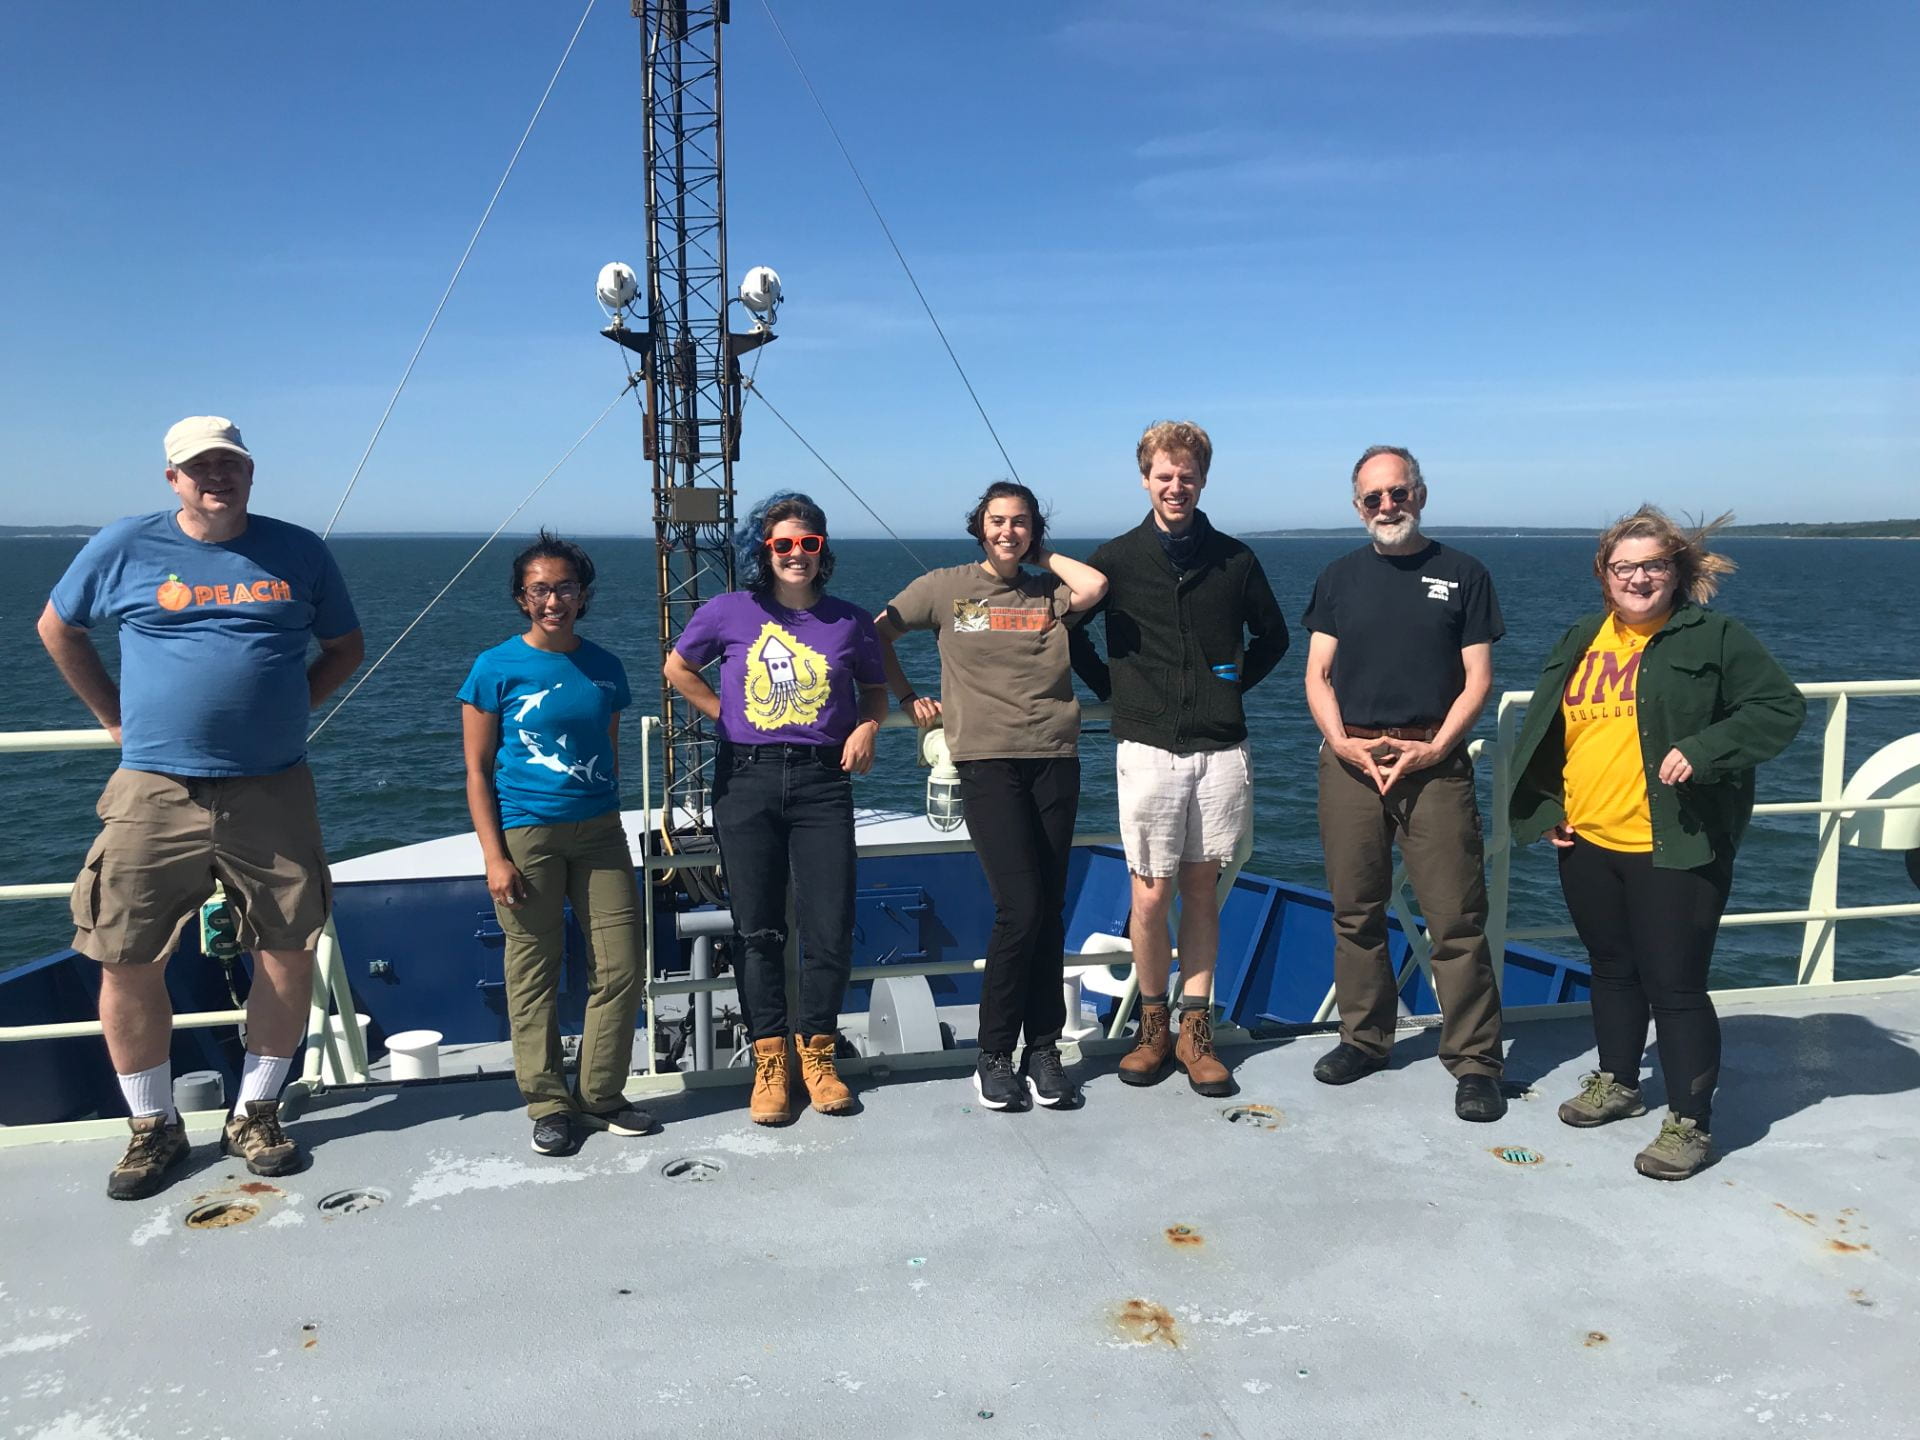
But first, who are we on board? Here is a picture of us:
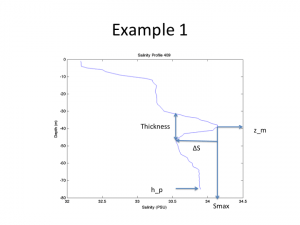
Since it is the Salinity Intrusion Experiment, it is a good time to show what the intrusion looks like.
Here is an example of a salinity intrusion from our Chief Scientist Glen Gawarkiewicz, WHOI. This is what an intrusion looks like in a vertical profile.
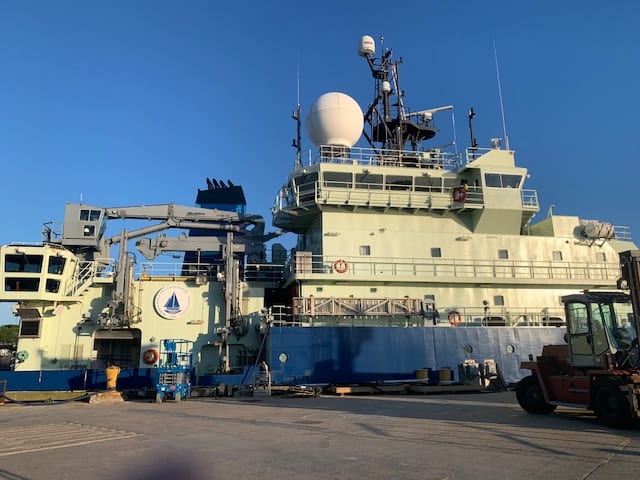
Well, some of us decided to come onboard in the evening of 17th, the day before we officially start our voyage on the SIRATES. The equipments are loaded. The vessel is ready.
Thanks to all the people at WHOI who has helped see through the COVID mitigation protocols and bring us safely to a safe ship. It was a good process and I must say a process well executed and resulted in a fully vaccinated science team and crew. We are all excited to begin this experiment with Armstrong. Here it is.
We are a group of scientists going together on a cruise to support the NSF funded Salinity Intrusions Project using the R/V Neil Armstrong. Our journey will begin from the Woods Hole Oceanographic Institution to the shelf break at about 100 m depth near the Pioneer Array region around 71W, 40N.
The Salinity Intrusions project is funded by NSF. The project is seeking to identify and map Salinity Maximum Intrusions extending from upper continental slope onto continental shelf. We will take turbulence measurements to identify the spatial and temporal patterns of mixing around the intrusions. One of the objectives is to determine their cross-shelf extent and how rapidly they evolve in time. The project is utilizing 4 AUV’s simultaneously as well as turbulence measurements. Surface signatures of Warm Core Rings and shelf-slope frontal meanders from satellites will guide us continuously during the two week period.
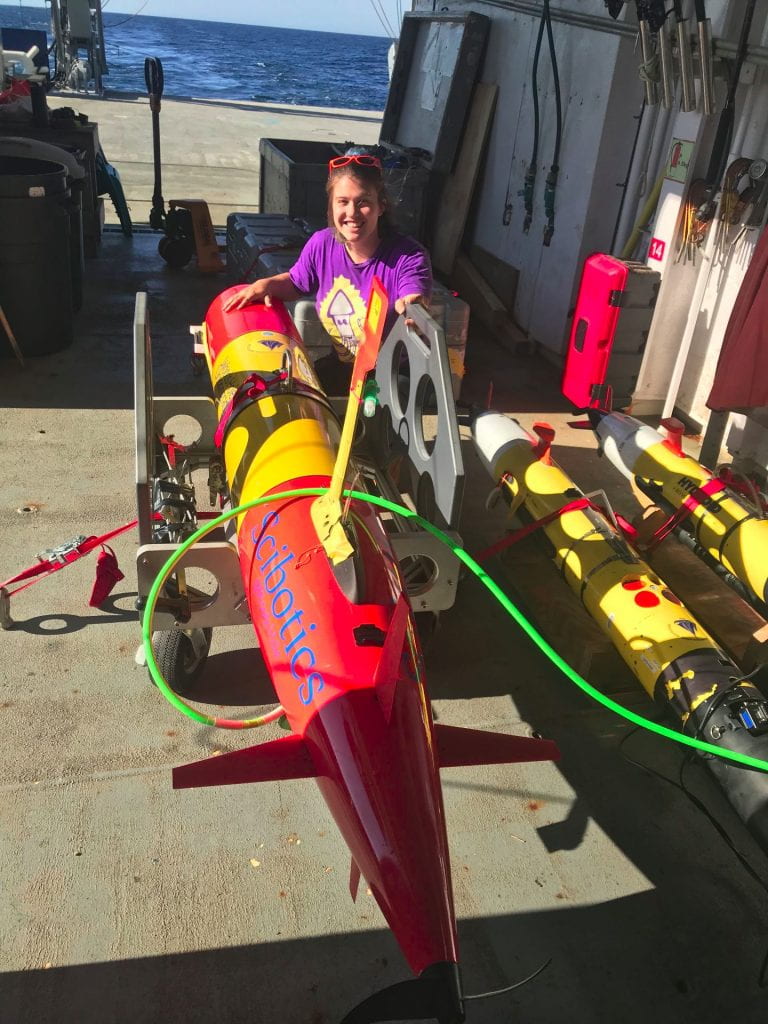
We have some cool instruments on board including multiple REMUS-100 and a Long Range AUV for mapping the intruding features in 3-D. Additionally the VMP will measure vertical microstructure and quantify turbulence parameters within the intrusion. We will describe them as we go along.
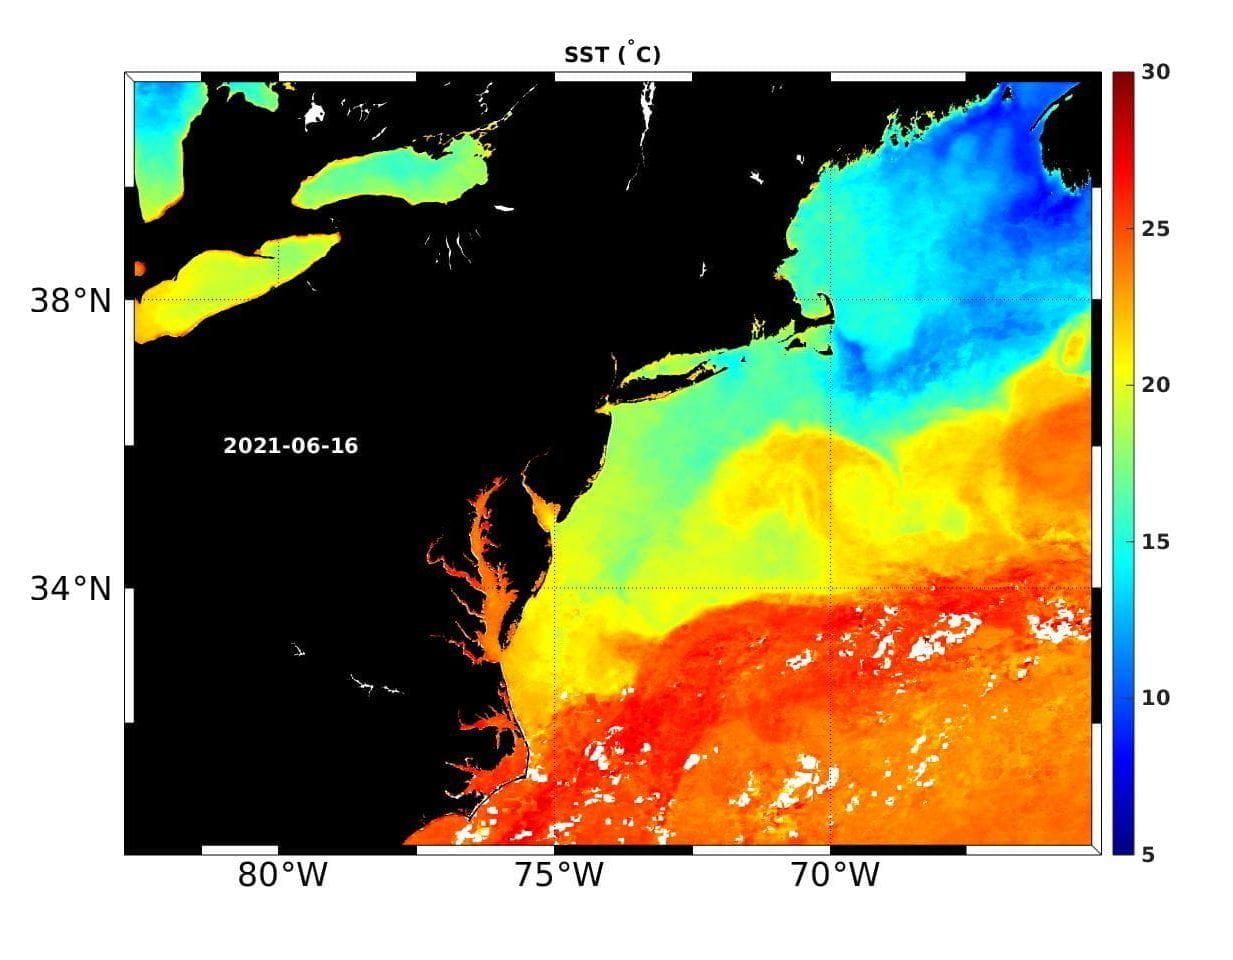
We will be looking for salty and warm intrusions of Gulf Stream and Warm Ring waters across the shelf break into the cool and fresh shelf waters of offshore of New England. Satellite data for temperature (SST), height (SSH tracks), Chlorophyll (SSC) will be used in addition to nearby Argo floats in the adjacent slope waters to develop the larger perspective of the increasing warming in the slope sea and its impact on the shelf ecosystem. A particular aspect of that ecosystem is the possibility of lining the intrusions with Squid. More on that later.
For today, June 16, 2016 — We received two satellite-derived products. The 7-day composite from MARACOOS site (Thanks to Adrienne) and the GS-Ring Analysis from Jenifer Clark (Thanks, Jenifer). We are ready for some interesting science ahead!